
AI Insights Tab
Patterns the AI spots across all your calls — what's correlated with winning, what's costing you deals
AI Insights Tab
The AI Insights tab is where Aura's AI does the work of looking across all your team's calls and surfacing patterns you'd never find by watching individual recordings. It answers questions like:
- "Which of the 7 stages, when done well, is most correlated with closing?"
- "What's the difference between the calls that close and the calls that don't?"
- "Are there specific moments in our calls that flip a deal toward yes or no?"
Dashboard Layout
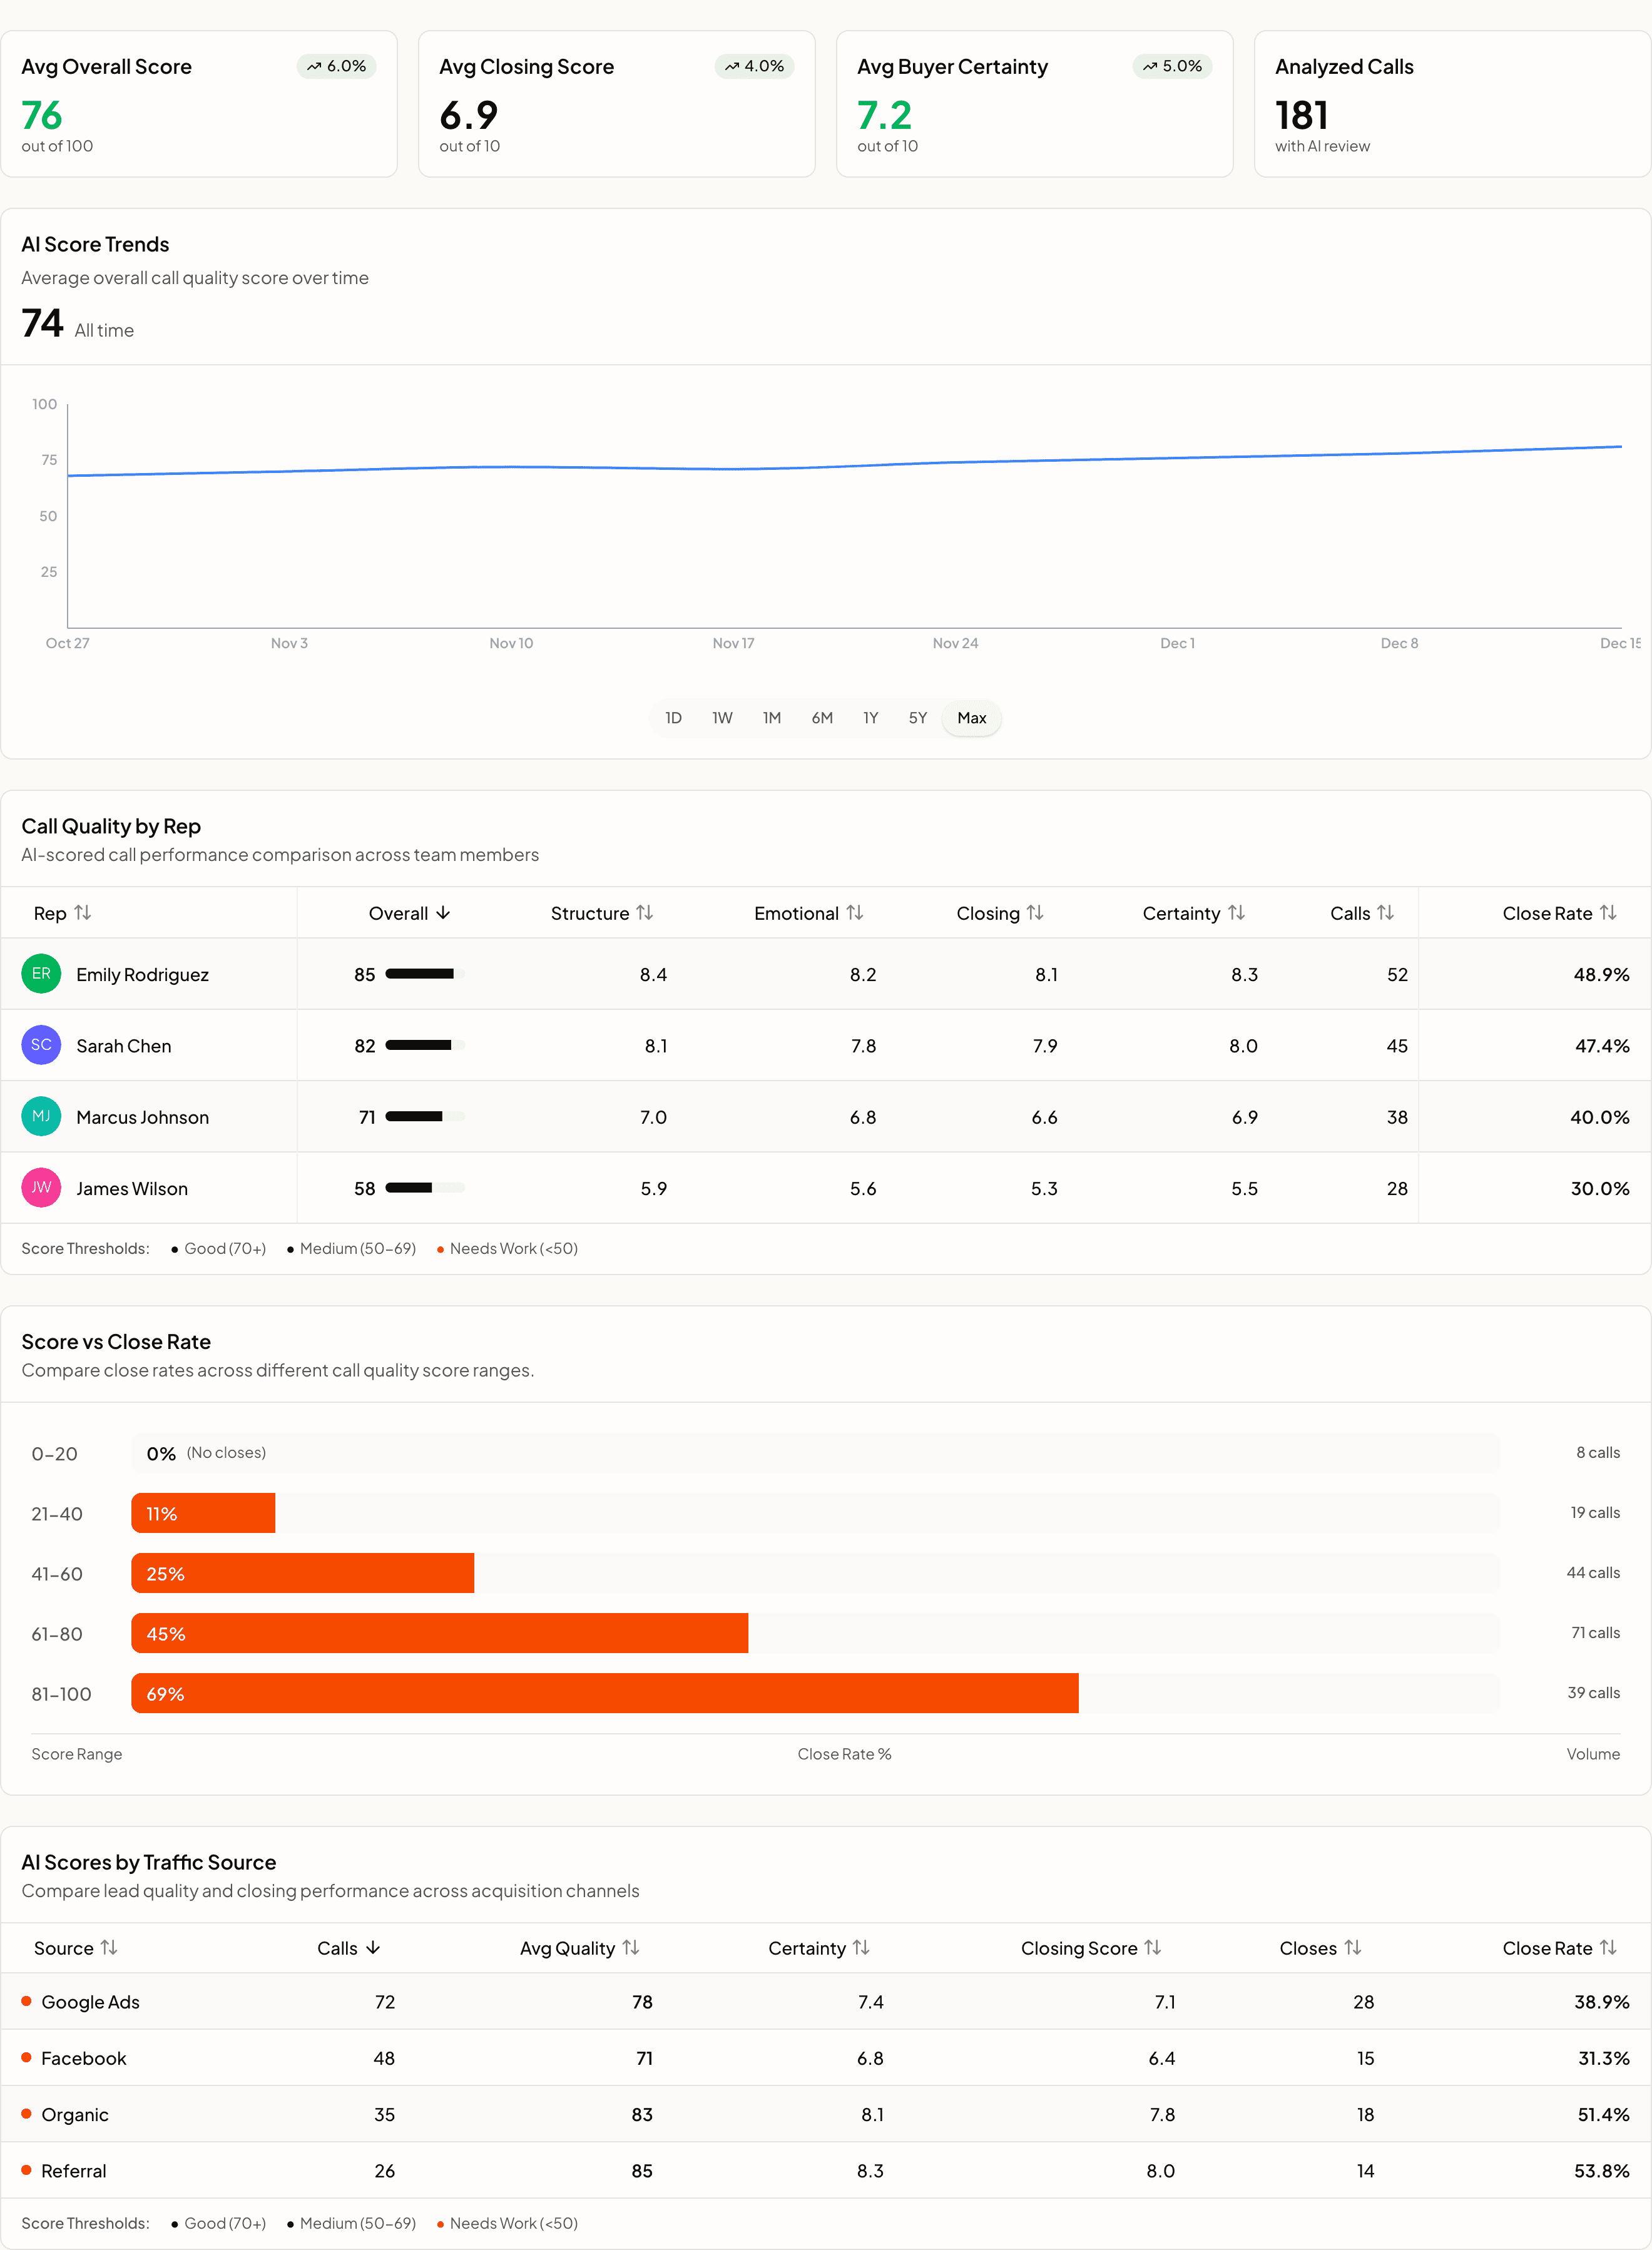
What's on the page
Stage correlation with winning
We take every call from your selected time range, compare won deals to lost deals, and show you which of the 7 stages makes the biggest difference.
You'll see something like:
Gap has the strongest correlation with closing. On calls where Gap scores ≥ 8, close rate is 47%. On calls where Gap scores ≤ 5, it's 12%.
That kind of insight is hard to get from just watching recordings — you need the AI scoring every call consistently and then doing the math across all of them.
Key moments
The AI also looks for specific kinds of moments in your calls:
| Moment type | What it is |
|---|---|
| Pain points | When the prospect describes the actual cost or pressure they're feeling |
| Budget mentioned | When they say something about money, price, or what they can afford |
| Objections | A specific concern or pushback they raise |
| Buying signals | Things they say that suggest they're leaning toward yes |
| Risk concerns | Hesitations about migration, switching, change |
| Next steps | Concrete agreements about what happens after the call |
For each type, you'll see how often they show up across your calls, how often they're handled successfully, and which reps are best at surfacing them.
Coaching themes
The AI rolls up the coaching feedback it generated for individual calls — missed questions, line rewrites, action steps — and looks for patterns across the team. If "tempo of price reveal" shows up as a missed action across 60% of last week's calls, that's a team-wide coaching opportunity.
How to use it
| What you want | Where to look |
|---|---|
| Decide what to coach this week | Coaching themes — the most common missed action across the team |
| Understand why your close rate dropped | Stage correlation — what's the biggest score change between this period and last? |
| Find which rep is best at handling objections | Key moments — objections column, sort by resolution rate |
| Identify buying signals you're missing | Key moments — buying signals not followed by a next-step lock |
Filters and date range
Same filters as the other Analytics tabs — date range, closer, booking link. The patterns the AI surfaces respect those filters, so you can ask things like "what's correlated with closing for this specific booking link?"
A note on sample size
The AI's patterns get more reliable as you accumulate more calls. If you've only got 10 calls in your selected date range, take the correlations with a grain of salt. The page will show you the sample size so you know how much to trust each insight.
Related
- 7-Stage Framework — what the AI is grading on each call
- Performance Tab — per-rep breakdowns
- Objections Tab — deep dive on objections specifically