
Attribution Tab
Lead sources, UTM performance, and channel effectiveness analysis
Attribution Tab
The Attribution tab helps you understand where your best leads come from. Track UTM performance, compare channels, and optimize your marketing spend based on actual sales outcomes.
Dashboard Layout
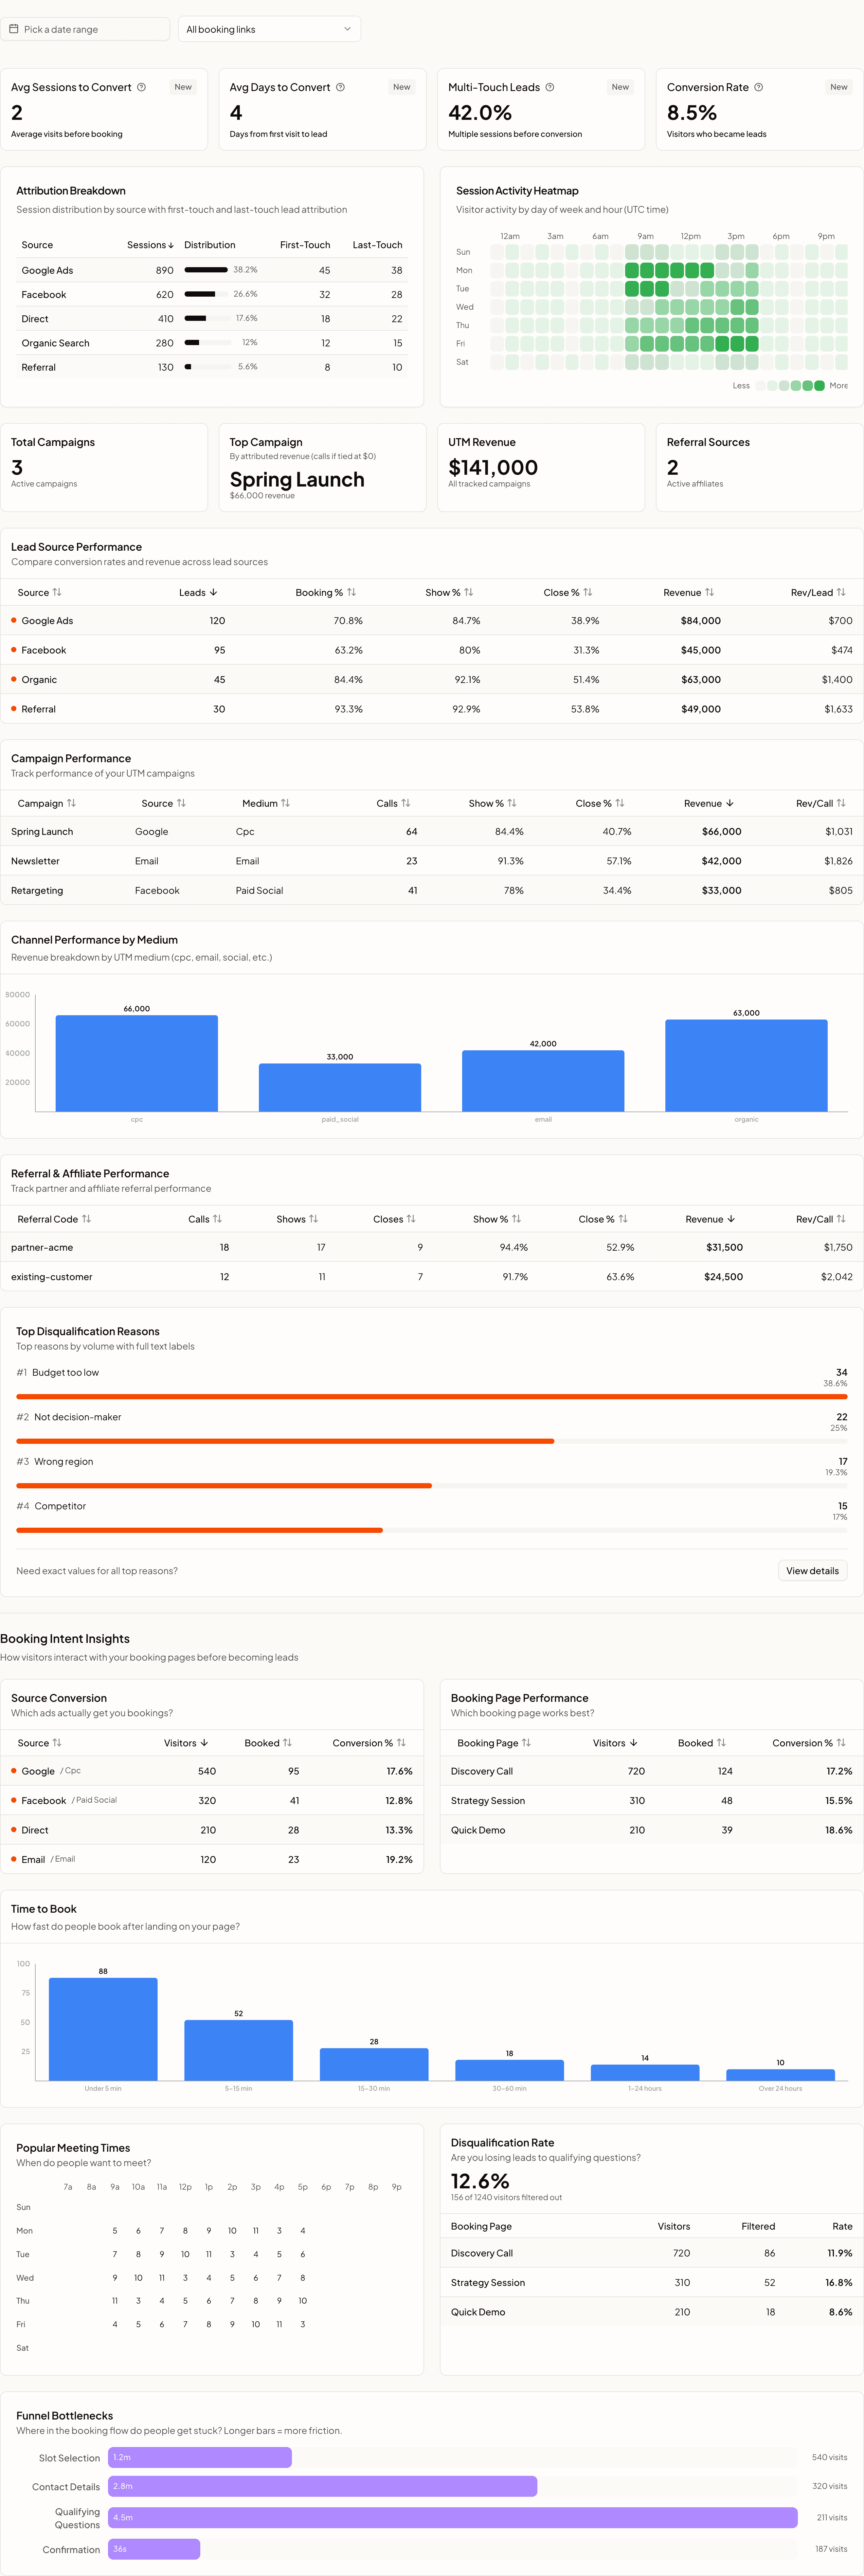
KPI Cards
Total Tracked Leads
Definition: Leads with attribution data captured.
What to watch:
- Percentage of total leads with attribution
- Gap = UTM coverage issue
- Should be close to 100%
Top Source
Definition: utm_source with highest lead volume.
Context:
- Volume ≠ Quality
- Compare with conversion metrics
- May differ by period
Best Conversion
Definition: Source with highest close rate.
Why it matters:
- Quality indicator
- Budget allocation signal
- Scale opportunity
Attributed Revenue
Definition: Total revenue traced to sources.
Calculation:
Attributed Revenue = Sum(Deal Value) where source knownLeads by Source
Distribution Chart
Visual breakdown of lead sources:
Source          Count    Percentage    Bar
─────────────────────────────────────────────────
Google            120       35%       ████████████
LinkedIn           78       23%       ████████
Organic            58       17%       ██████
Referral           48       14%       █████
Email              28        8%       ███
Other              10        3%       █
─────────────────────────────────────────────────
Total             342      100%
Source Definition
Mapped from utm_source:
- google: Google Ads, organic
- linkedin: LinkedIn ads, organic posts
- organic: Direct/no source
- referral: Partner, ref parameter
- email: Email campaigns
Channel Performance Table
Full Metrics
Comprehensive view by source:
| Source | Leads | Show % | Close % | Revenue | Rev/Lead | Apex Avg |
|---|---|---|---|---|---|---|
| 120 | 78% | 28% | $52,000 | $433 | 74 | |
| 78 | 85% | 42% | $68,000 | $872 | 79 | |
| Organic | 58 | 82% | 35% | $38,000 | $655 | 76 |
| Referral | 48 | 88% | 48% | $42,000 | $875 | 81 |
| 28 | 75% | 32% | $18,000 | $643 | 72 |
Sorting & Analysis
Click columns to sort and find:
- Volume leaders: Most leads
- Quality leaders: Highest close rate
- Value leaders: Highest revenue
- Efficiency leaders: Highest rev/lead
Key Insights
From the example:
- Google: High volume, low conversion
- LinkedIn: Good volume, best close rate
- Referral: Low volume, highest quality
Campaign Analysis
UTM Campaign Breakdown
Drill into specific campaigns:
utm_source=google
─────────────────────────────────────────────────────
Campaign            Leads    Close%    Revenue
─────────────────────────────────────────────────────
brand-search          45      35%      $22,000
competitor-search     32      22%      $12,000
display-retargeting   28      28%      $14,000
generic-search        15      18%       $4,000
─────────────────────────────────────────────────────
Campaign Comparison
Compare campaign performance:
- Same source, different campaigns
- Same campaign, different sources
- A/B test analysis
Medium Analysis
UTM Medium Breakdown
Medium         Leads    Show%    Close%    Revenue
─────────────────────────────────────────────────────
cpc             152      78%      28%      $58,000
organic          58      82%      35%      $38,000
social           48      84%      38%      $35,000
email            42      76%      30%      $24,000
referral         42      88%      48%      $42,000
─────────────────────────────────────────────────────
Medium Insights
- cpc: Paid traffic quality
- organic: Content effectiveness
- social: Social presence value
- referral: Partner program success
Funnel by Source
Conversion Funnel
Track each source through funnel:
GOOGLE (utm_source=google)
─────────────────────────────────────────────────────
Leads Created:        120   (100%)
      ↓
Scheduled:            108   (90%)
      ↓
Attended:              84   (70%)
      ↓
Won:                   34   (28%)
─────────────────────────────────────────────────────

LINKEDIN (utm_source=linkedin)
─────────────────────────────────────────────────────
Leads Created:         78   (100%)
      ↓
Scheduled:             74   (95%)
      ↓
Attended:              66   (85%)
      ↓
Won:                   33   (42%)
─────────────────────────────────────────────────────
Drop-off Analysis
Identify where sources leak:
- Google: Big drop at Attended (-20%)
- LinkedIn: Strong through funnel
Time-Based Analysis
Source Trends
Track source performance over time:
Month      Google    LinkedIn    Organic    Referral
─────────────────────────────────────────────────────
January       32         18         15          12
February      38         22         18          14
March         42         28         22          16
April         48         32         25          18
─────────────────────────────────────────────────────
Seasonality
Identify patterns:
- LinkedIn stronger in Q1 (planning)
- Referral builds over time
- Paid search consistent
Custom Reference (ref)
Partner Tracking
Using ref parameter:
ref=partner-acme       42 leads    45% close    $38K
ref=webinar-jan        28 leads    38% close    $18K
ref=ebook-download     15 leads    25% close     $8K
Use Cases
- Partner attribution
- Content tracking
- Event tracking
- Individual link tracking
ROI Analysis
Calculate Channel ROI
If you track marketing spend:
Channel     Spend     Revenue    Leads    CAC      ROI
─────────────────────────────────────────────────────
Google     $15,000   $52,000     120    $125    247%
LinkedIn   $12,000   $68,000      78    $154    467%
Email       $2,000   $18,000      28     $71    800%
─────────────────────────────────────────────────────
ROI Calculation
ROI = (Revenue - Spend) / Spend × 100
CAC = Spend / Leads
LTV/CAC = Avg Deal Size / CAC
Actionable Insights
Budget Recommendations
Based on data:
🔴 REDUCE SPEND
─────────────────────────────────────────
Google Generic Search: 18% close, $267/lead
• Consider pausing or reducing budget
• Test different landing pages first

🟢 INCREASE SPEND
─────────────────────────────────────────
LinkedIn: 42% close, $872 revenue/lead
• Highest quality source
• Scale with confidence
• Test similar audiences

🟡 OPTIMIZE
─────────────────────────────────────────
Google Brand Search: 35% close, $489/lead
• Good but can improve
• A/B test ad copy
• Review landing page
Missing Attribution
Unattributed Leads
Track leads without source:
Attributed:      342 (85%)
Unattributed:     58 (15%)
─────────────────────────────────────────
Common Causes
- Direct visits (bookmarked)
- UTM stripped (referrer policy)
- Organic search
- Word of mouth
Improving Attribution
- Use UTMs on all links
- Add ref parameters
- Track booking link sources
- Ask "How did you hear about us?"
Exporting
Available Reports
- Source Summary: Channel overview
- Campaign Detail: UTM breakdown
- Funnel Analysis: Source conversion
- ROI Report: With spend data
Integration
Export to:
- Marketing dashboards
- Budget planning tools
- Executive reports
Best Practices
UTM Discipline
- Consistent naming: Standardize values
- Document conventions: Team alignment
- URL builders: Use tools to prevent errors
- Regular audits: Check for rogue UTMs
Analysis Rhythm
- Weekly: Check lead sources
- Monthly: Full channel analysis
- Quarterly: ROI review, budget planning
Decision Framework
| Close Rate | Volume | Action |
|---|---|---|
| High | High | Scale aggressively |
| High | Low | Find more inventory |
| Low | High | Optimize/reduce |
| Low | Low | Consider pausing |
Next Steps
- UTM Tracking - Set up attribution
- Overview Tab - High-level metrics