
Overview Tab
High-level KPIs, revenue trends, and booking metrics
Overview Tab
The Overview tab is your executive dashboard. See the health of your sales operation at a glance with key performance indicators, revenue trends, and pipeline metrics.
Dashboard Layout
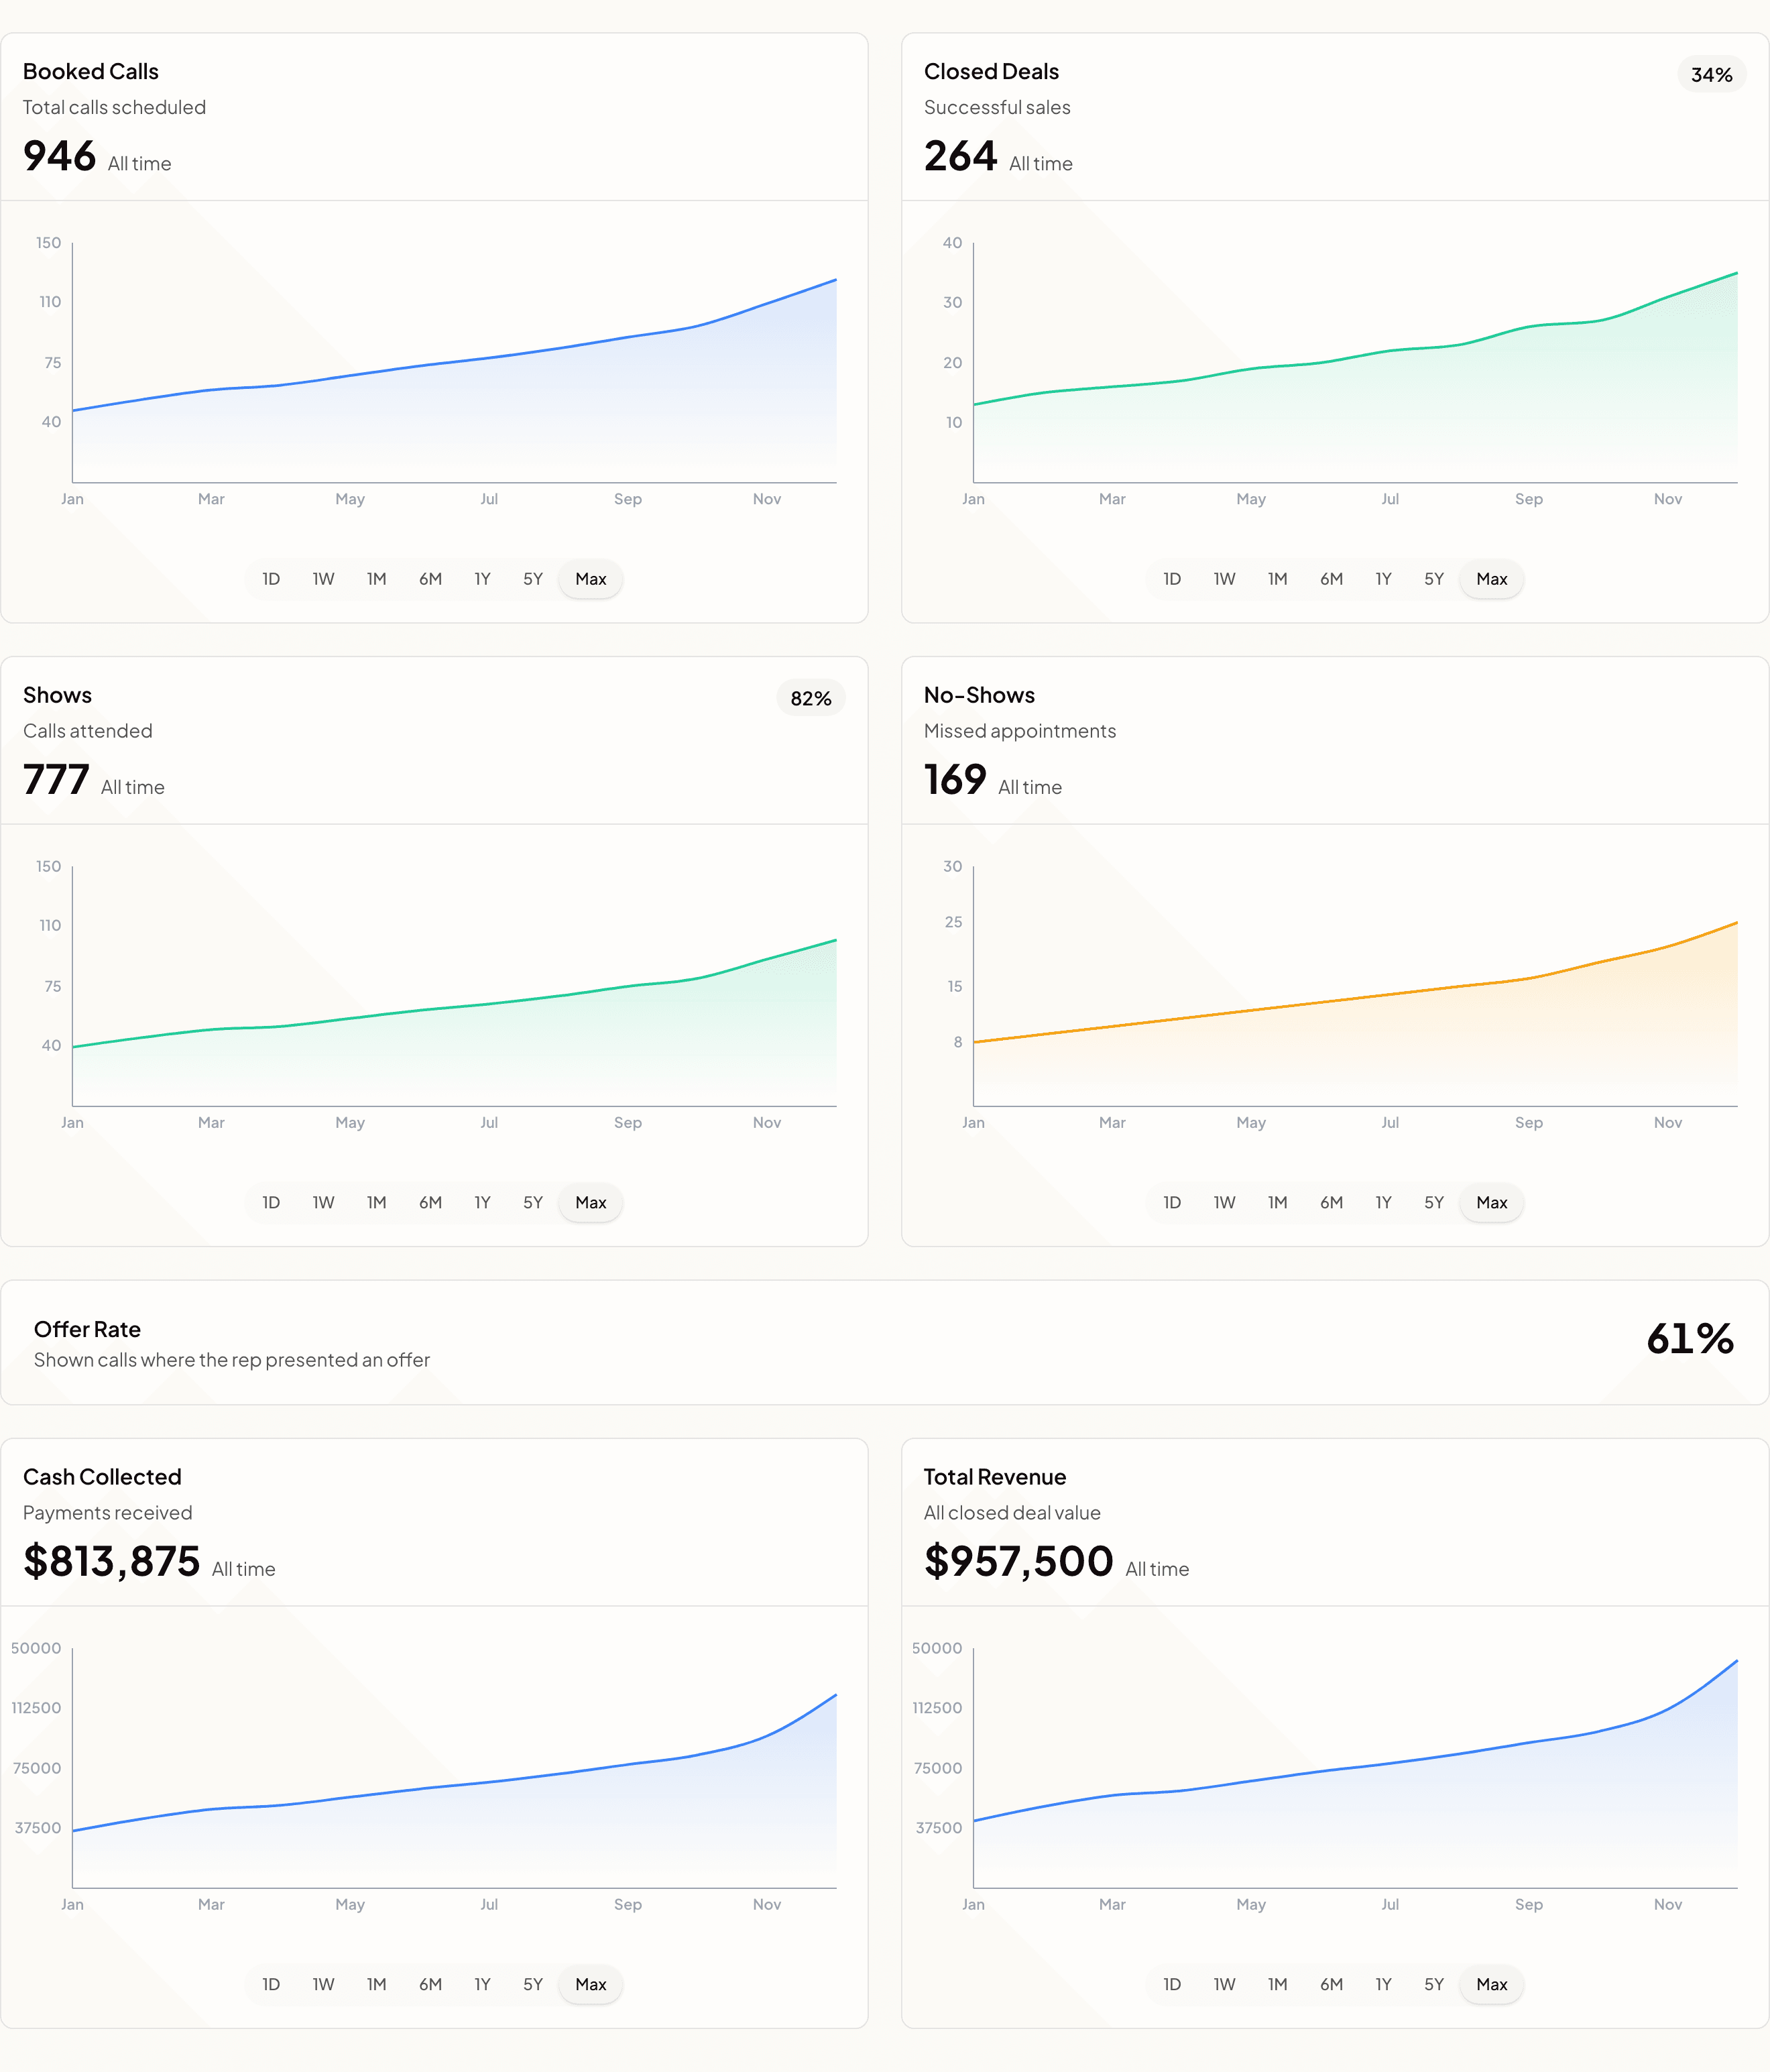
KPI Cards
Bookings
Definition: Total number of meetings scheduled in the period.
| Component | Description |
|---|---|
| Number | Count of bookings |
| Trend | % change vs. previous period |
| Arrow | Direction indicator |
What to watch:
- Sudden drops (lead gen issue?)
- Spikes (campaign working?)
- Week-over-week consistency
Show Rate
Definition: Percentage of scheduled calls that were attended.
Calculation:
Show Rate = Attended Calls / Scheduled Calls × 100Benchmarks:
| Rate | Assessment |
|---|---|
| Above 85% | Excellent |
| 75-85% | Good |
| 65-75% | Average |
| Under 65% | Needs improvement |
What to watch:
- Low rate → qualify harder, send reminders
- Declining rate → check lead quality
- Rep variation → coaching opportunity
Close Rate
Definition: Percentage of attended calls that result in won deals.
Calculation:
Close Rate = Won Deals / Attended Calls × 100Benchmarks (vary by industry):
| Rate | Assessment |
|---|---|
| Above 40% | Excellent |
| 25-40% | Good |
| 15-25% | Average |
| Under 15% | Needs improvement |
What to watch:
- Declining rate → review call quality
- Rep variation → coaching opportunity
- Product/market fit signals
Revenue
Definition: Total cash collected in the period.
What to watch:
- Target progress
- Deal size trends
- Revenue velocity
Revenue Trend Chart
Chart Type
Area chart showing revenue over time.
Time Granularity
Automatically adjusts:
| Date Range | Granularity |
|---|---|
| Today | Hourly |
| This Week | Daily |
| This Month | Daily |
| This Quarter | Weekly |
| This Year | Monthly |
Reading the Chart
- Area fill: Cumulative revenue
- Line: Revenue trajectory
- Comparison: Previous period overlay (optional)
Bookings by Status
Pie/Donut Chart
Shows distribution of bookings:
| Status | Color | Description |
|---|---|---|
| Scheduled | Blue | Upcoming calls |
| Attended | Green | Completed calls |
| Won | Dark Green | Closed deals |
| Lost | Red | Lost deals |
| Cancelled | Gray | Cancelled meetings |
| No-show | Orange | No-shows |
Interpretation
- Healthy: Most in Attended/Won
- Warning: High Cancelled/No-show
- Opportunity: Many Attended without outcome
Pipeline Summary
Current Pipeline
Shows leads by stage:
Stage          Count    Value
─────────────────────────────
Interested       12    $0
Qualified         8    $0
Scheduled        45    $180,000
Attended         15    $75,000
─────────────────────────────
Total Active     80    $255,000
Weighted Pipeline
For forecasting (if deal values set):
Weighted Value = Sum(Deal Value × Stage Probability)Example stage probabilities:
| Stage | Probability |
|---|---|
| Interested | 10% |
| Qualified | 25% |
| Scheduled | 40% |
| Attended | 60% |
Additional Metrics
Bookings Over Time
Line chart showing:
- Booking volume trends
- Day-of-week patterns
- Seasonality
Conversion Funnel
Bookings:     127  (100%)
      ↓
Attended:     104  (82%)
      ↓
Outcome Set:   68  (65%)
      ↓
Won:          23   (34%)
Average Deal Size
Avg Deal Size = Total Revenue / Won DealsTrack over time to identify:
- Deal size trends
- Product mix shifts
- Pricing effectiveness
Filtering
Date Range Impact
| Range | Best For |
|---|---|
| Today | Real-time monitoring |
| This Week | Short-term trends |
| This Month | Monthly review |
| This Quarter | Business review |
| Custom | Specific analysis |
Team Filter
- All: Organization overview
- Individual: Rep-specific view
- Useful for managers reviewing team
Comparison Mode
Enable to see:
- Current vs. previous period
- Year-over-year comparison
- Goal tracking
Insights & Actions
When Bookings Drop
- Check lead sources (Attribution tab)
- Review booking link performance
- Analyze competitor activity
- Verify marketing campaigns
When Show Rate Falls
- Review lead quality
- Check reminder effectiveness
- Analyze time-to-meeting
- Consider qualification changes
When Close Rate Drops
- Review call recordings (Calls)
- Check Apex scores (Performance tab)
- Analyze objection patterns (Objections tab)
- Compare to historical baseline
When Revenue is Off
- Check deal count vs. deal size
- Review close rate
- Analyze pipeline coverage
- Identify stuck deals
Best Practices
Daily Check
- Review today's bookings
- Check any no-shows
- Note revenue progress
Weekly Review
- Compare to previous week
- Identify trends
- Plan for upcoming week
Monthly Analysis
- Full funnel analysis
- Team comparison
- Goal progress
- Strategy adjustments
Exporting
Available Exports
- KPI Summary: PDF with key metrics
- Raw Data: CSV of underlying data
- Charts: PNG images
Scheduling Reports
Set up recurring reports:
- Click Schedule
- Choose frequency
- Select recipients
- Customize content
Next Steps
- Performance Tab - Dive into team metrics
- AI Insights Tab - Call quality trends
- Attribution Tab - Lead source analysis