
Objections Tab
Objection heat maps, resolution rates, and pattern analysis
Objections Tab
The Objections tab helps you understand what's blocking deals. See which objections come up most, how well they're handled, and identify patterns that can improve your win rate.
Dashboard Layout
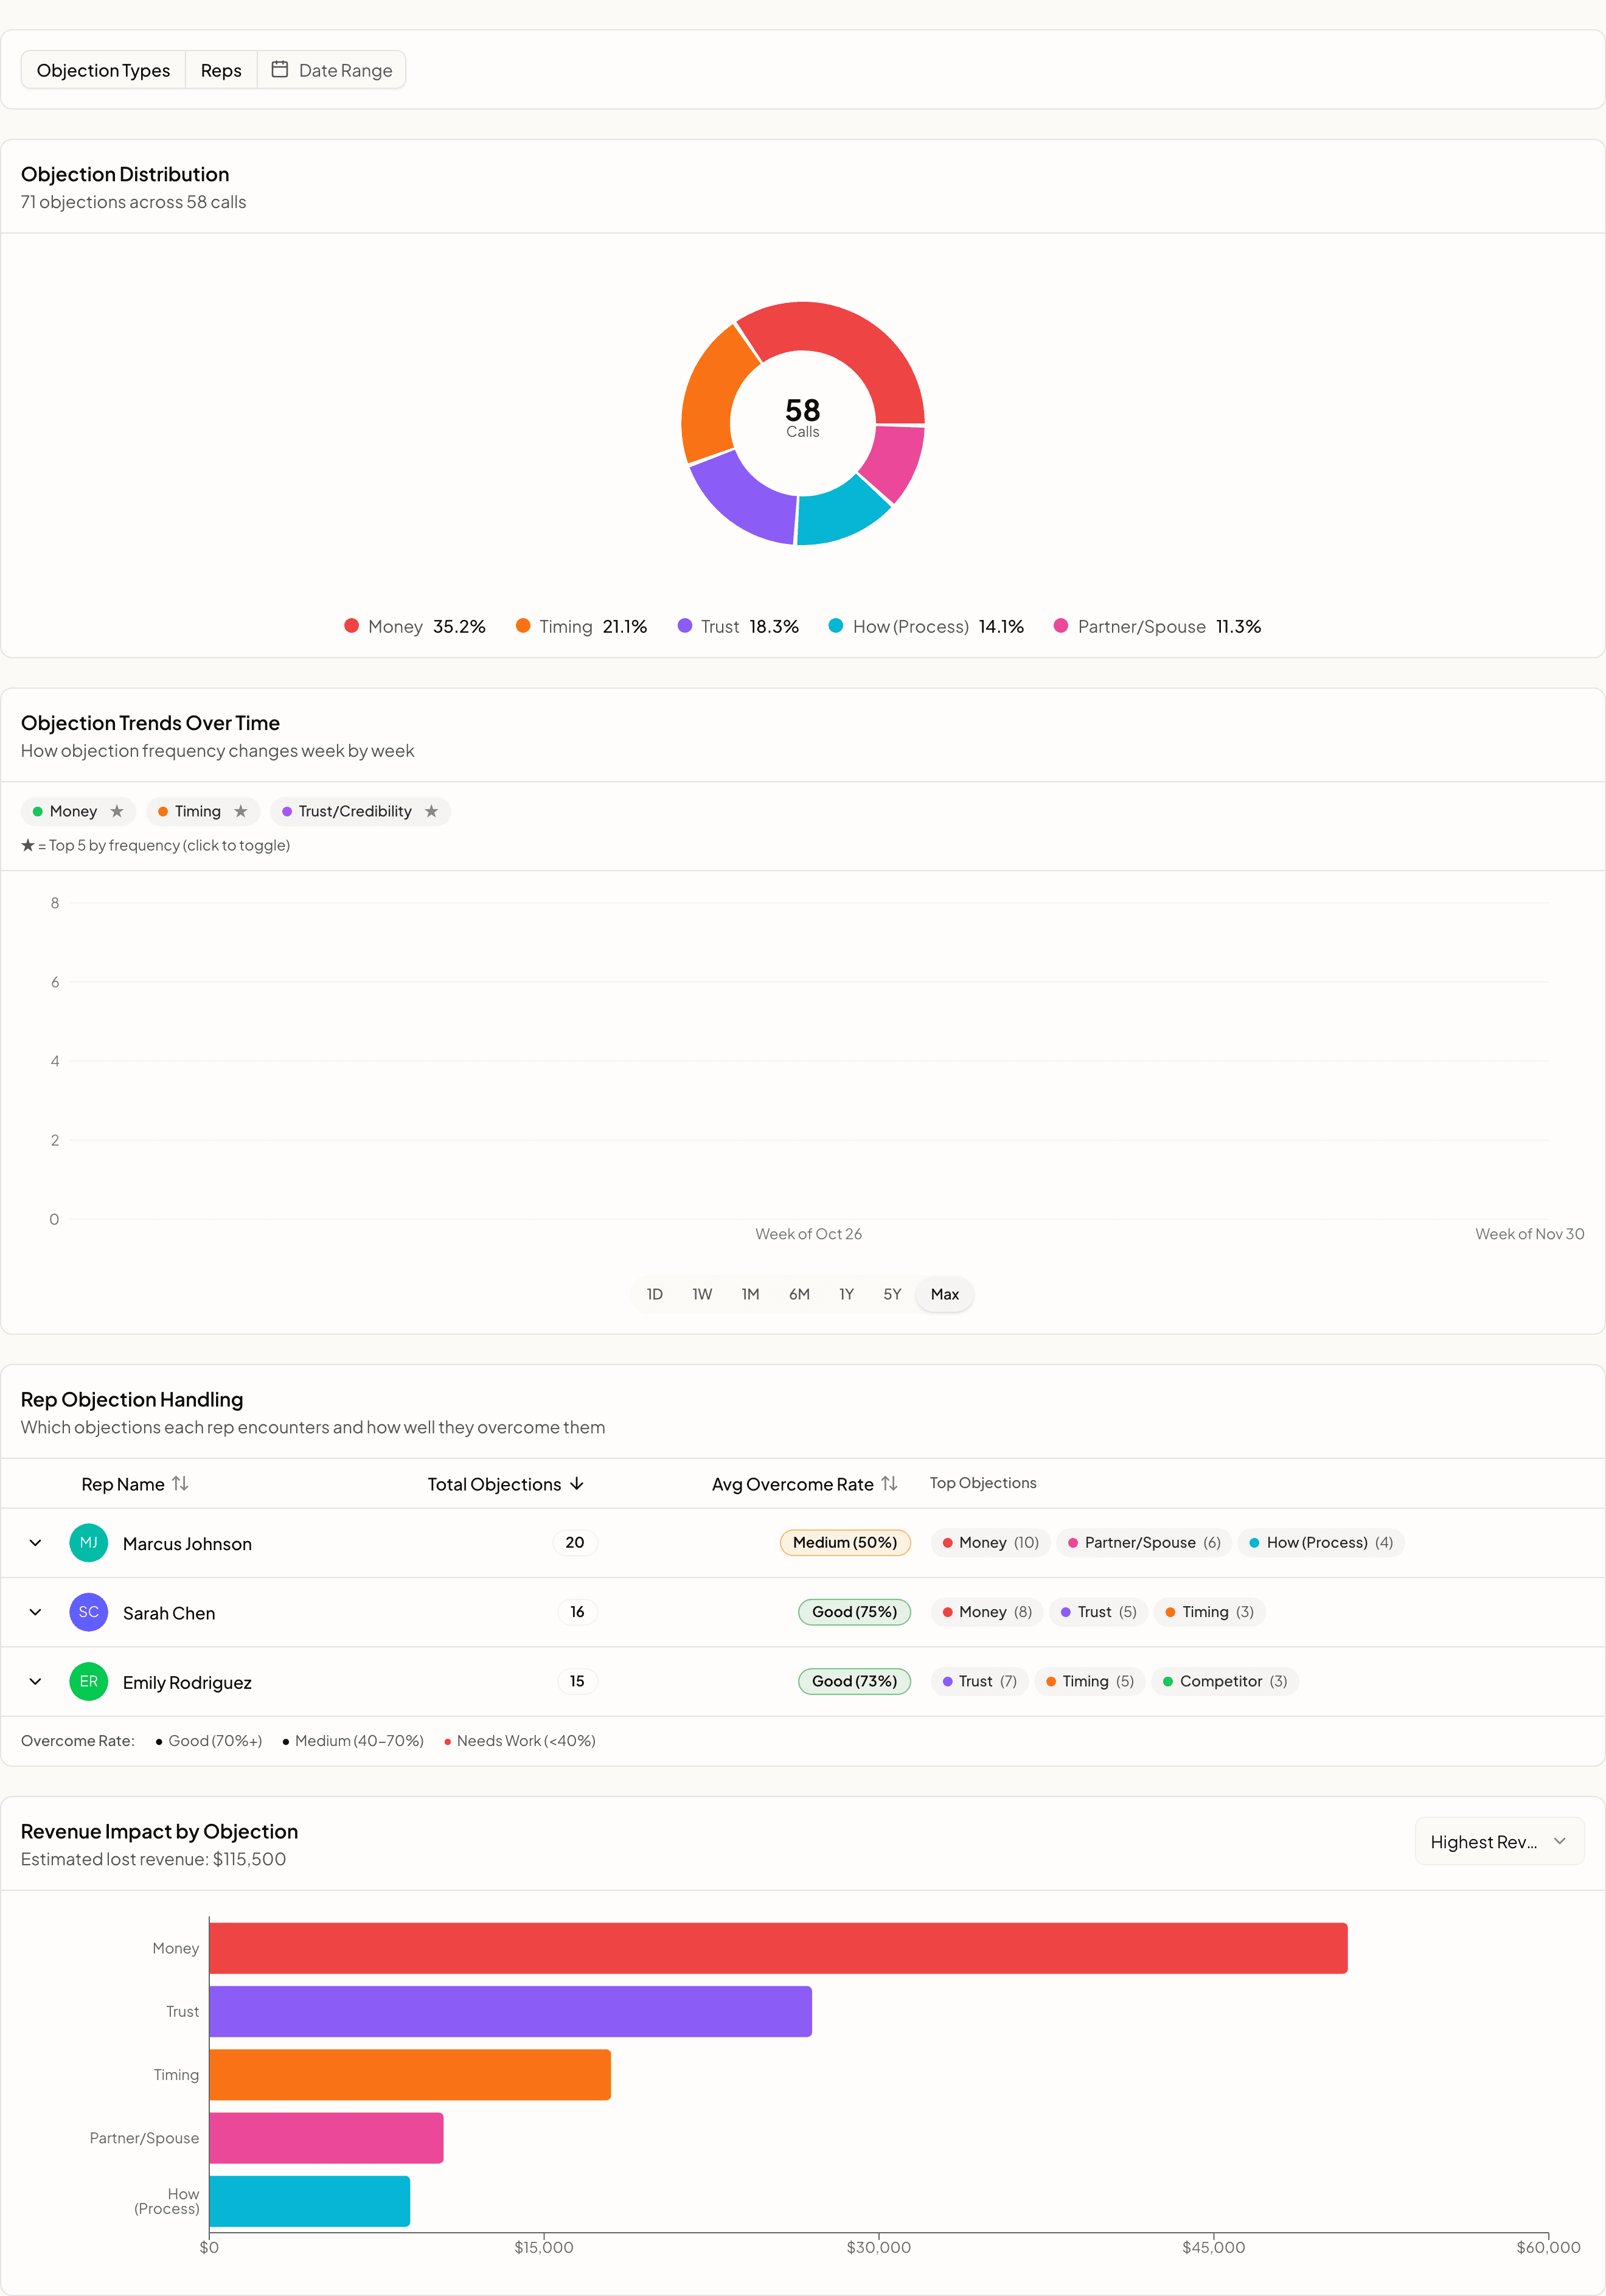
KPI Cards
Total Objections
Definition: Count of objections detected across all calls in period.
What to watch:
- High count might indicate messaging issues
- Trend matters more than absolute number
- Compare to booking volume
Resolved
Definition: Objections that were addressed during the call.
What counts as resolved:
- Clear response provided
- Concern acknowledged and addressed
- Prospect indicated satisfaction
Resolution Rate
Definition: Percentage of objections that were handled.
Calculation:
Resolution Rate = Resolved Objections / Total Objections × 100Benchmarks:
| Rate | Assessment |
|---|---|
| ≥80% | Excellent |
| 70-79% | Good |
| 60-69% | Needs Work |
| Under 60% | Concerning |
Top Issue
Definition: Most frequent objection category.
Why it matters:
- Indicates primary blocker
- Focus area for training
- May signal market feedback
Objection Heat Map
Visual Representation
Shows objection distribution:
Category        Bar                         Count   %
─────────────────────────────────────────────────────────
Price          ████████████████████████████   60   42%
Timing         ████████████████               33   23%
Competition    █████████████                  26   18%
Risk           █████████                      14   10%
Authority      ██████                          9    7%
─────────────────────────────────────────────────────────
Total                                        142  100%
Interpreting the Heat Map
| Pattern | Insight | Action |
|---|---|---|
| One dominant | Primary issue | Focus training here |
| Even distribution | Multiple barriers | Address systematically |
| New category spike | Market change | Update positioning |
Resolution by Category
Category Performance
Category        Raised    Resolved    Rate    Trend
──────────────────────────────────────────────────────────
Price             60        41        68%      ↓ -5%
Timing            33        27        82%      ↑ +3%
Competition       26        20        75%      → 0%
Risk              14        12        85%      ↑ +8%
Authority          9         7        78%      → 0%
──────────────────────────────────────────────────────────
Identifying Weaknesses
Low resolution rates indicate:
- Need for better responses
- Training opportunity
- Possible positioning issue
Correlation with Outcomes
Category         Resolution Rate    Win Rate (when resolved)
───────────────────────────────────────────────────────────
Price                 68%                  45%
Risk                  85%                  52%
Competition           75%                  38%
───────────────────────────────────────────────────────────
Objection Trends
Over Time
Track how objections change:
Month       Total    Price    Timing    Competition
────────────────────────────────────────────────────
January       95      38%      28%         20%
February     102      40%      25%         22%
March        118      42%      24%         21%
April        124      44%      22%         19%
May          130      45%      21%         18%
────────────────────────────────────────────────────
Seasonal Patterns
Some objections are seasonal:
- Timing: Spikes at year-end (budget cycles)
- Budget: Higher in Q1 (new fiscal year)
Market Shifts
Watch for:
- New competitor mentions
- Economic-driven objections
- Product-related patterns
Drill-Down Analysis
By Rep
Compare objection handling across team:
Rep            Objections    Resolution    Price Handling
─────────────────────────────────────────────────────────
Alice              28           82%            75%
Bob                35           74%            62%
Carol              24           79%            70%
Dan                32           71%            58%
─────────────────────────────────────────────────────────
By Booking Link
See which sources generate objections:
Link             Objections/Call    Top Objection
──────────────────────────────────────────────────────
Enterprise           2.1             Price (48%)
SMB                  1.4             Timing (35%)
Inbound              1.2             Competition (30%)
Outbound             1.8             Authority (28%)
──────────────────────────────────────────────────────
By Call Stage
When do objections arise:
Call Timing          % of Objections
─────────────────────────────────────
Discovery                 15%
Presentation             35%
Demo                     30%
Close                    20%
─────────────────────────────────────
Objection Details
Viewing Specific Objections
Click any category to see examples:
PRICE OBJECTIONS (60 total)
─────────────────────────────────────────────────────
"That's more than we budgeted for"                 23
"Can you match competitor pricing?"                12
"We need to see more value before that investment"  8
"The ROI isn't clear"                               7
"Our budget was cut this quarter"                   5
Other                                               5
─────────────────────────────────────────────────────
Example Responses
See how top performers handle:
OBJECTION: "That's more than we budgeted"
─────────────────────────────────────────────────────
Alice (resolved, won):
"I understand budget is a consideration. Let me
share how TechCorp saw 3x ROI within 6 months..."
[Watch clip: 18:34]

Bob (not resolved, lost):
"I hear you. What if we could do a smaller pilot?"
[Watch clip: 22:15]
─────────────────────────────────────────────────────
Building Response Library
From Analytics to Action
- Identify top objections
- Review successful handling
- Document best responses
- Train team
- Measure improvement
Response Template Structure
For each objection:
- Acknowledge: Validate the concern
- Clarify: Understand specifics
- Respond: Address with evidence
- Confirm: Check if resolved
Example Library Entry
OBJECTION: Price - "It's too expensive"
─────────────────────────────────────────────────────
RESPONSE FRAMEWORK:

1. ACKNOWLEDGE
"I appreciate you sharing that. Budget is always
an important consideration."

2. CLARIFY
"When you say expensive, are you comparing to
[alternative] or to your allocated budget?"

3. RESPOND (by answer)
If comparing to alternative:
"While our list price is higher, let me show you
the total cost of ownership including [factors]..."

If budget constraint:
"I understand. Let me share how [similar company]
justified the investment by focusing on [ROI]..."

4. CONFIRM
"Does that help address your concern about the
investment?"
─────────────────────────────────────────────────────
Actionable Insights
Priority Actions
Based on data:
🔴 HIGH PRIORITY
─────────────────────────────────────────
Price objections at 42% with 68% resolution
• 32% unresolved = lost opportunity
• Create price objection workshop
• Build ROI calculator tool
• Role-play practice sessions

🟡 MEDIUM PRIORITY
─────────────────────────────────────────
Competition mentions increasing (+15% MoM)
• Update competitive battlecards
• Research competitor changes
• Arm team with differentiators
Filtering
By Category
Focus on specific objection types:
- All categories
- Single category deep-dive
- Compare categories
By Resolution
- All objections
- Resolved only
- Unresolved only
By Outcome
- Won deals (what objections did they have?)
- Lost deals (what wasn't resolved?)
Exporting
Available Reports
- Heat Map Summary: Category distribution
- Resolution Analysis: By rep/category
- Response Library: Best practices
- Trend Report: Over time analysis
Best Practices
For Sales Reps
- Review top objections weekly
- Practice responses for weak areas
- Watch successful handling examples
- Track personal resolution rate
For Managers
- Monitor team resolution rates
- Create targeted training
- Update response library
- Celebrate improvements
For Organizations
- Track objection trends quarterly
- Inform product/marketing of patterns
- Maintain current battlecards
- Measure training effectiveness
Next Steps
- AI Insights Tab - Score correlations
- Attribution Tab - Objections by source
- Calls - Individual call objections